

 Data research · Dashboards · Reporting
We turn messy, massive datasets into clear answers.
Data research, custom dashboards and reporting for e-commerce, SaaS, finance and service businesses. We pull your scattered data into one place, find what is really driving the numbers, and explain every chart in plain English, so you can make decisions in seconds instead of digging through spreadsheets.

 Interactive 3D map · 2,443 accounts & liquidity pools
Engineered Volume, Retail Exposure
How one operator faked trading activity on 1,141 new tokens, and what it cost the everyday buyers it drew in.
The operator made each token look popular by buying it from its own accounts. When outside buyers joined in, it took the money back out, often within a minute, leaving them with tokens they could not sell.
The operator reused the same ~50 ETH (~$121,000) for every token. ETH is the currency on Robinhood Chain, a public blockchain network built by Robinhood. All figures come from public records; dollar values use that day's ETH price.
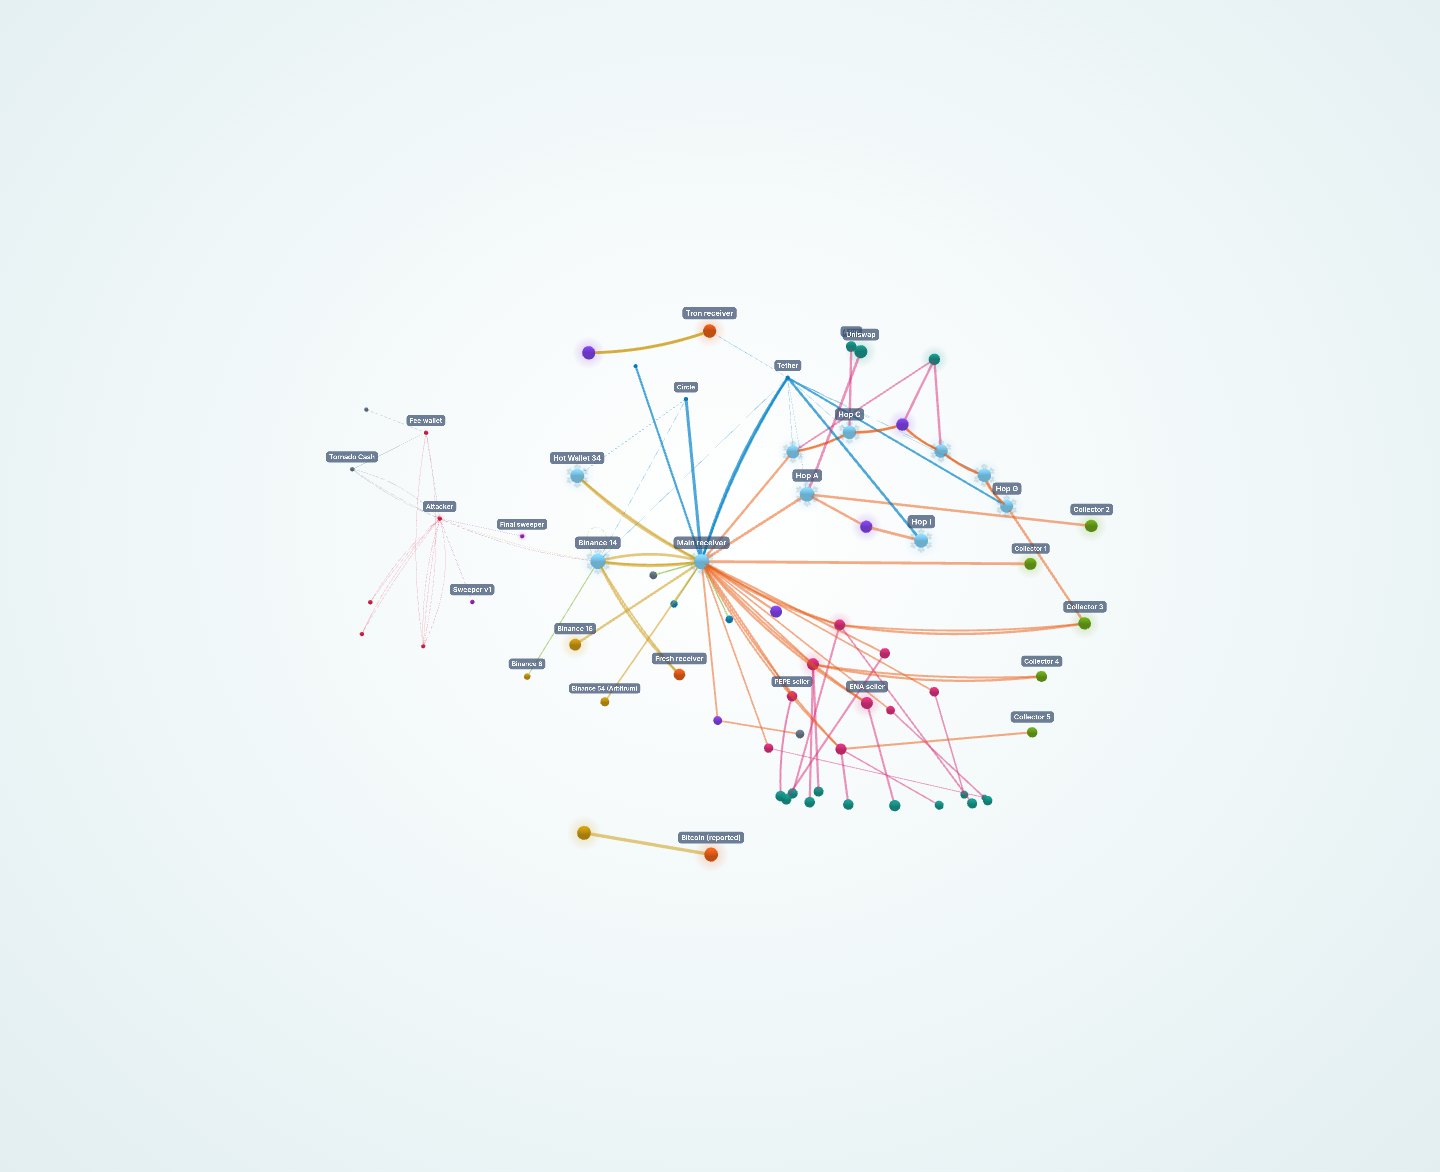
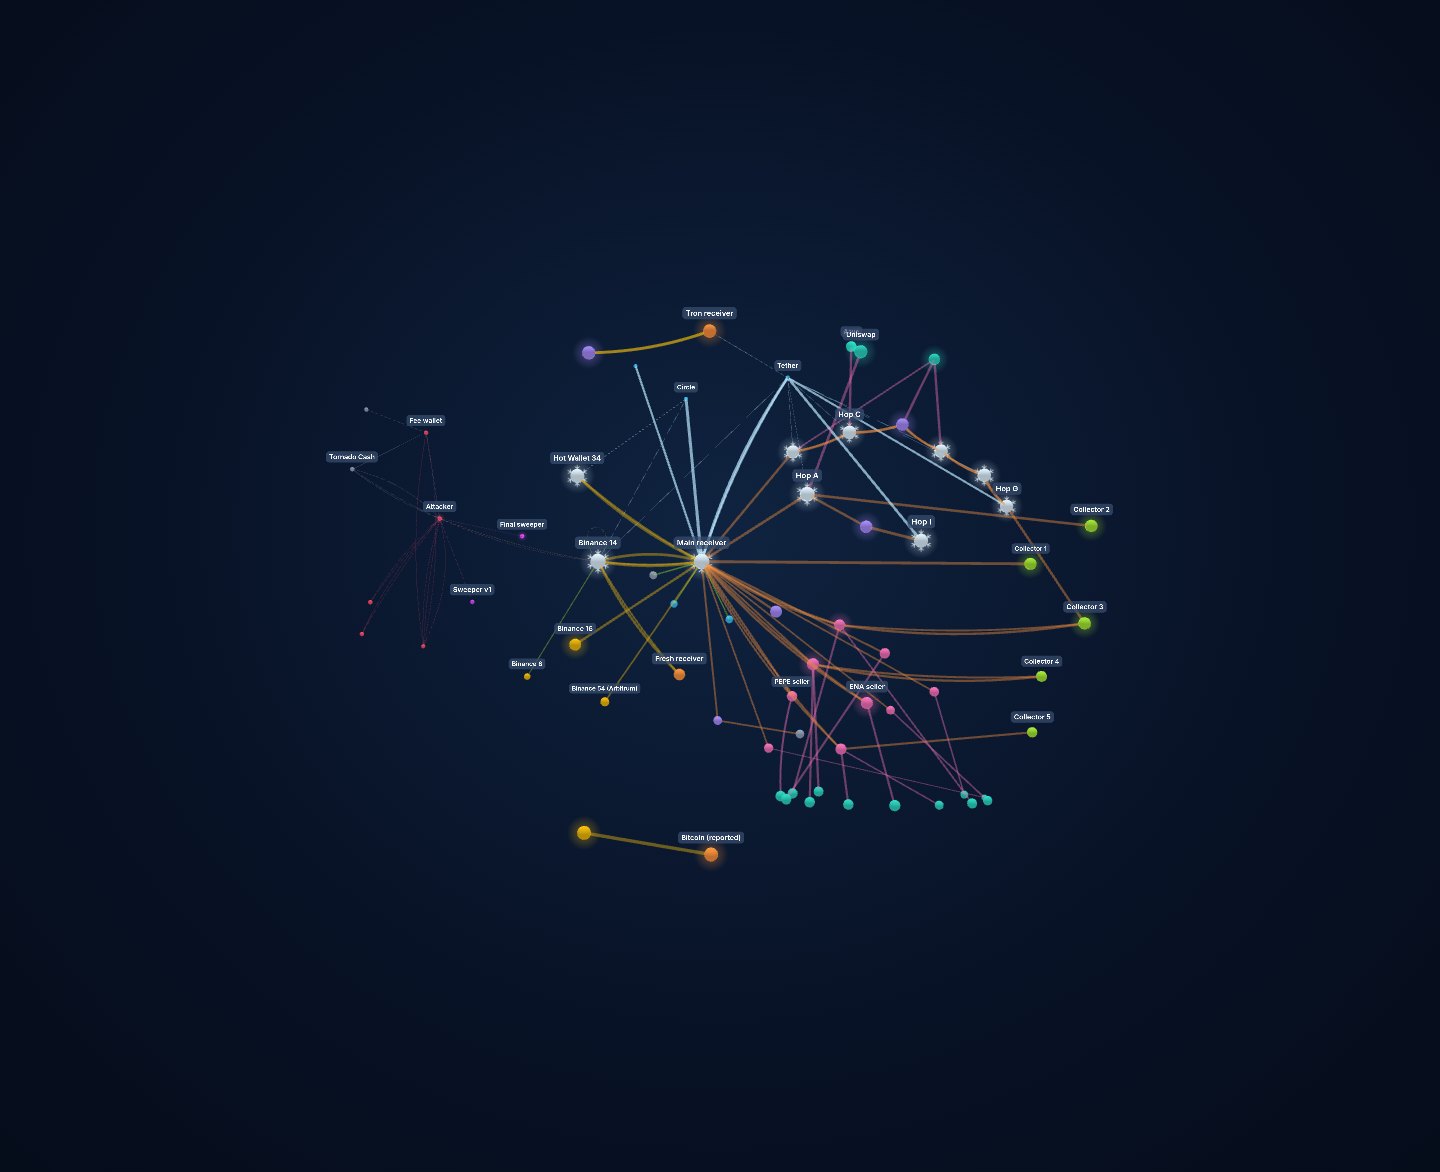 Interactive 3D timeline · 112 events, 67 wallets
One Signature, $3.8 Billion
How the Binance hot-wallet hack unfolded, minute by minute: one signed approval, about $3.8 billion out in 20 minutes, and where the money went.
Binance's own key signed an approval that let the attacker's code run inside its busiest hot wallet, the wallet it keeps online to pay out withdrawals. Stablecoin issuers froze about $2.25B. The rest was turned into ETH (Ether), which nobody can freeze.
Ethereum is a public blockchain network, and ETH is its currency. Stablecoins such as Tether USD (USDT) and USD Coin (USDC) are tokens pegged to $1 that their issuers can freeze. All figures come from public records; figures we could not verify are marked as reported on the study page.
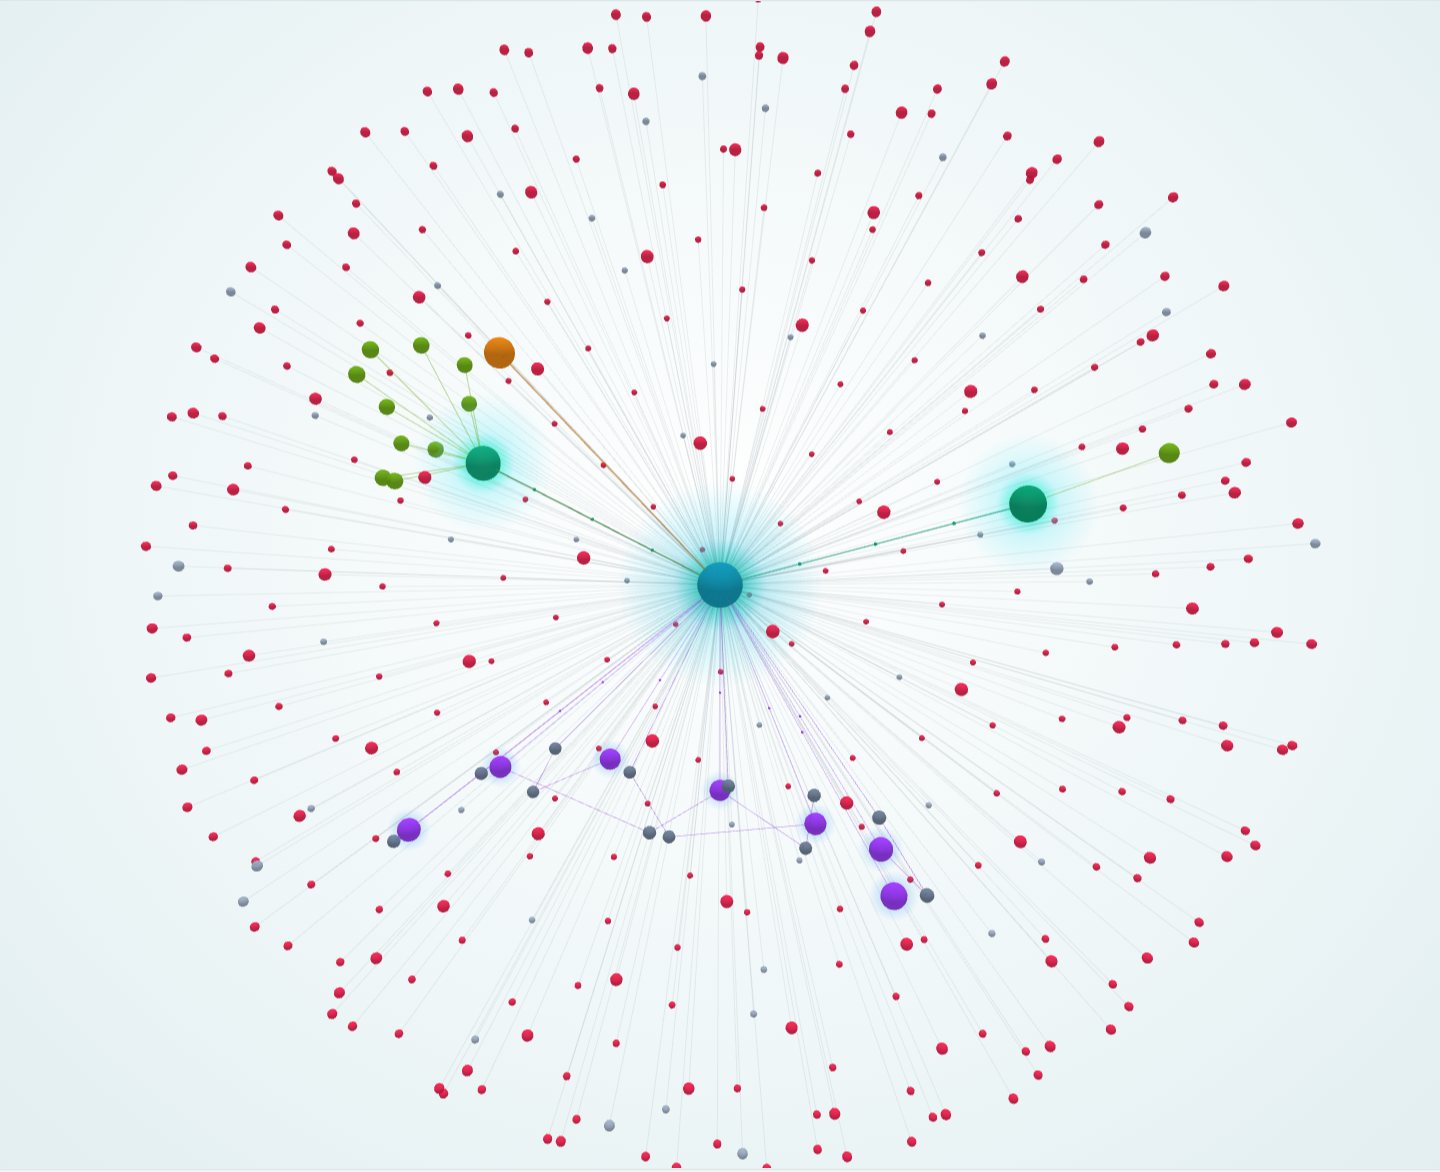
 Interactive 3D map · 1 launcher, 7 fake buyers, 349 sample coins
Gone in Six Seconds
One pump.fun wallet launches about 425 meme coins a day and sells each one within seconds. We checked a viral thread about it against public records.
The developer wallet makes money; the outside buyers lose it. It profited on 302 of 349 sampled coins (about +959 SOL, Solana's currency). Its fake buyers' losses are its own money, spent to make its coins look busy.
SOL is the currency of Solana, a public blockchain network; during the study 1 SOL was worth about $100. pump.fun is a site where anyone can launch a meme coin in one click. All figures come from public records.
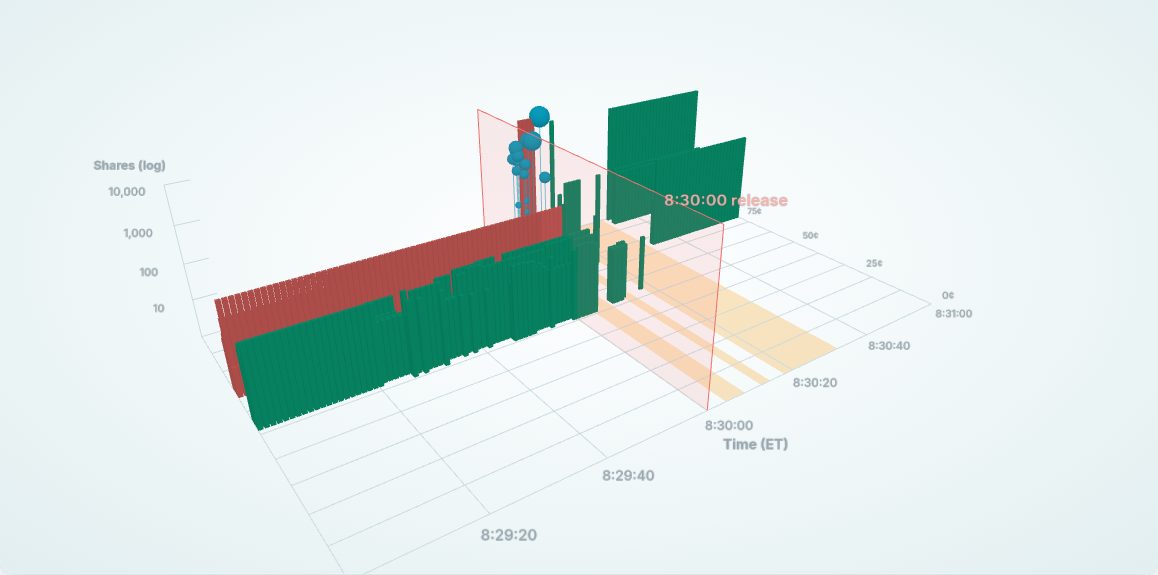
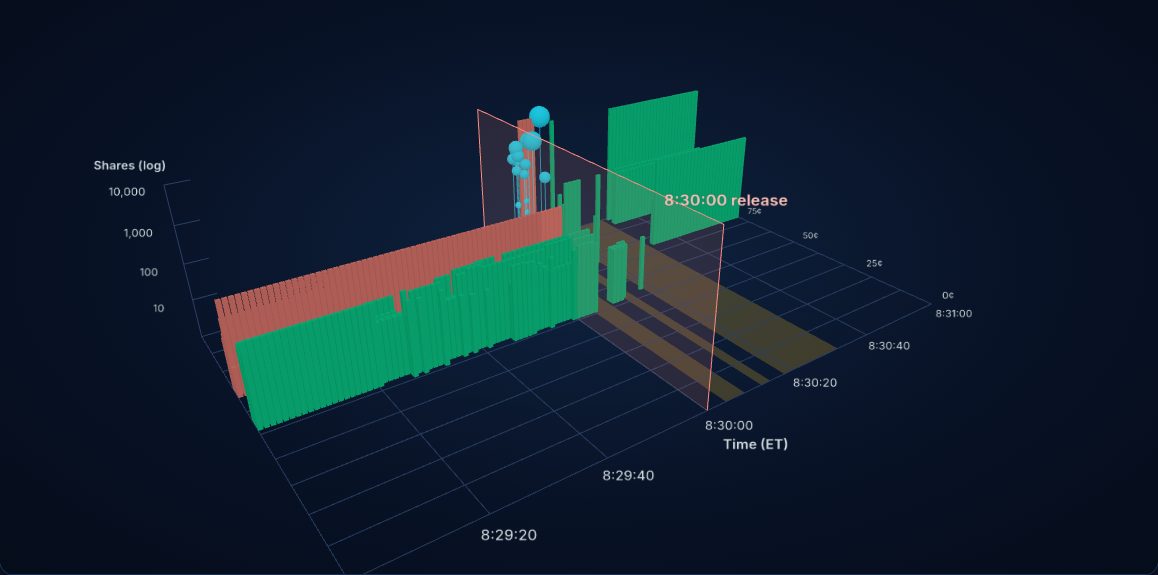 Interactive 3D order book · 21 outcomes
Release Replay: Growth & Inflation Data
How Polymarket prices moved, second by second, when the Bureau of Economic Analysis (BEA) released Gross Domestic Product (GDP) and Personal Consumption Expenditures (PCE) inflation numbers.
Before 8:30 the favorite outcomes were priced at 61–70¢. Within about 17 seconds of the release they reached 99¢.
Data only. Not investment advice. Prices are in cents per $1 share.
Sample dashboards
Click through, change the filters, and flip between light and dark mode. Both use generated sample data.
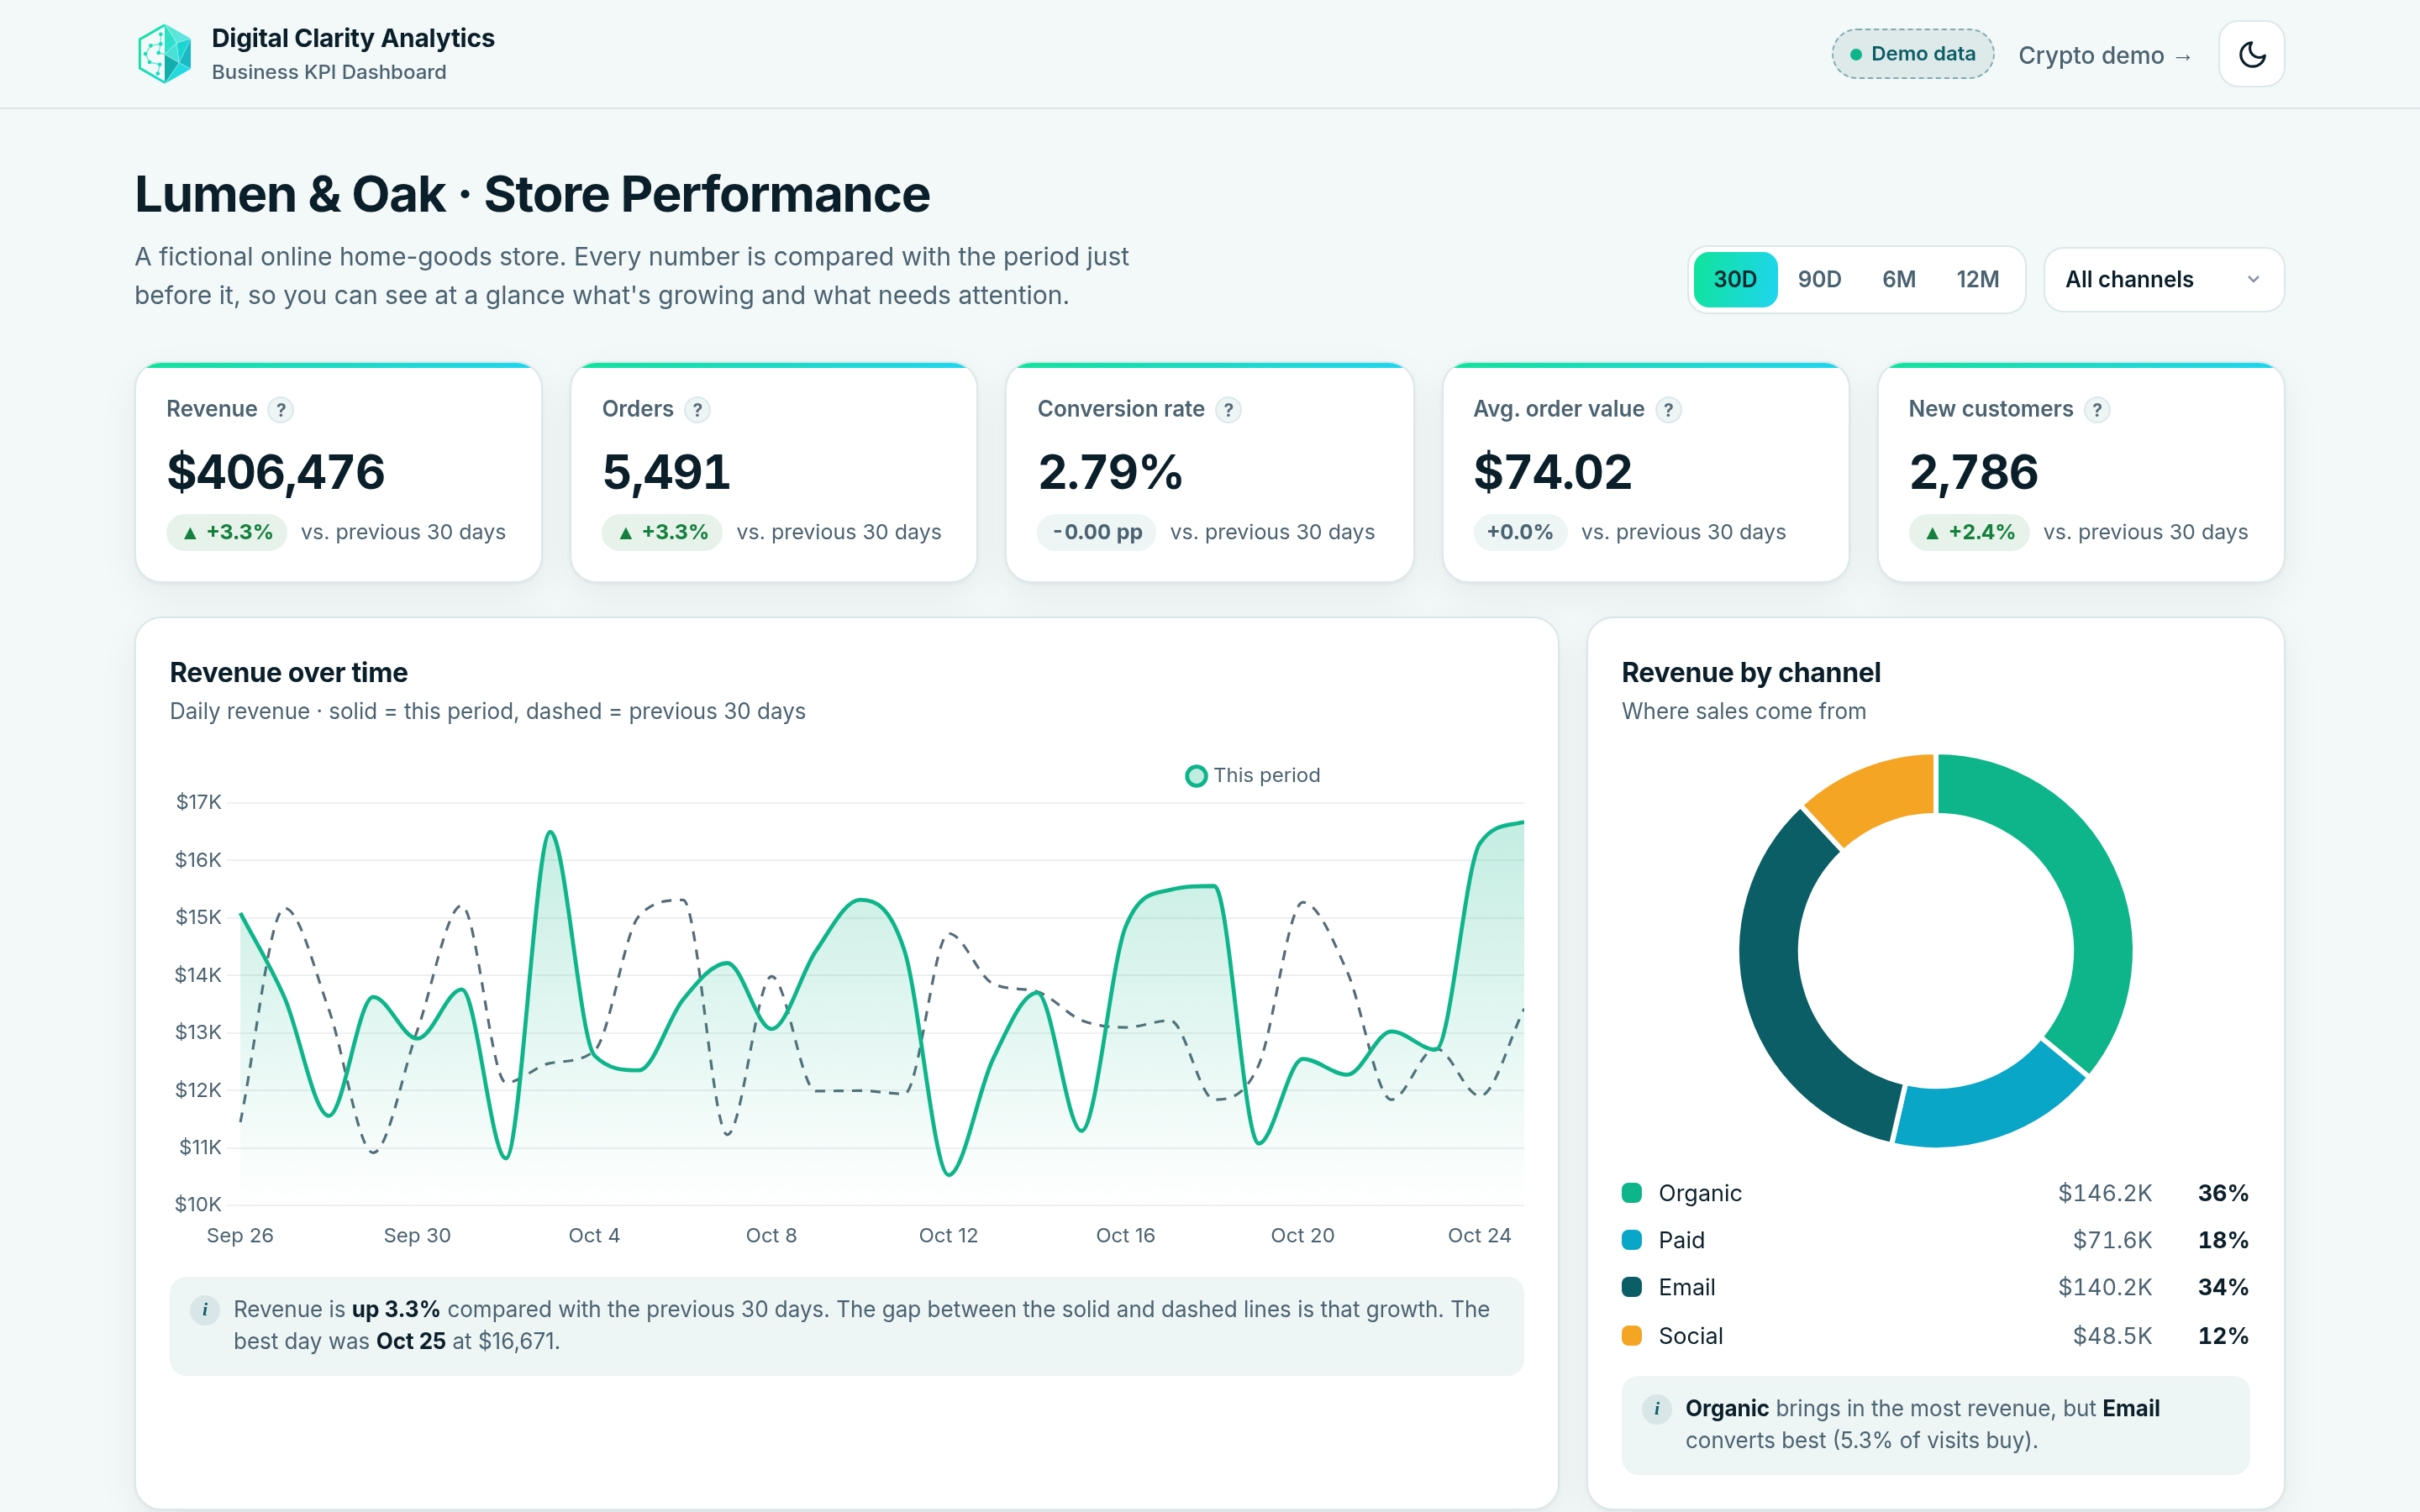
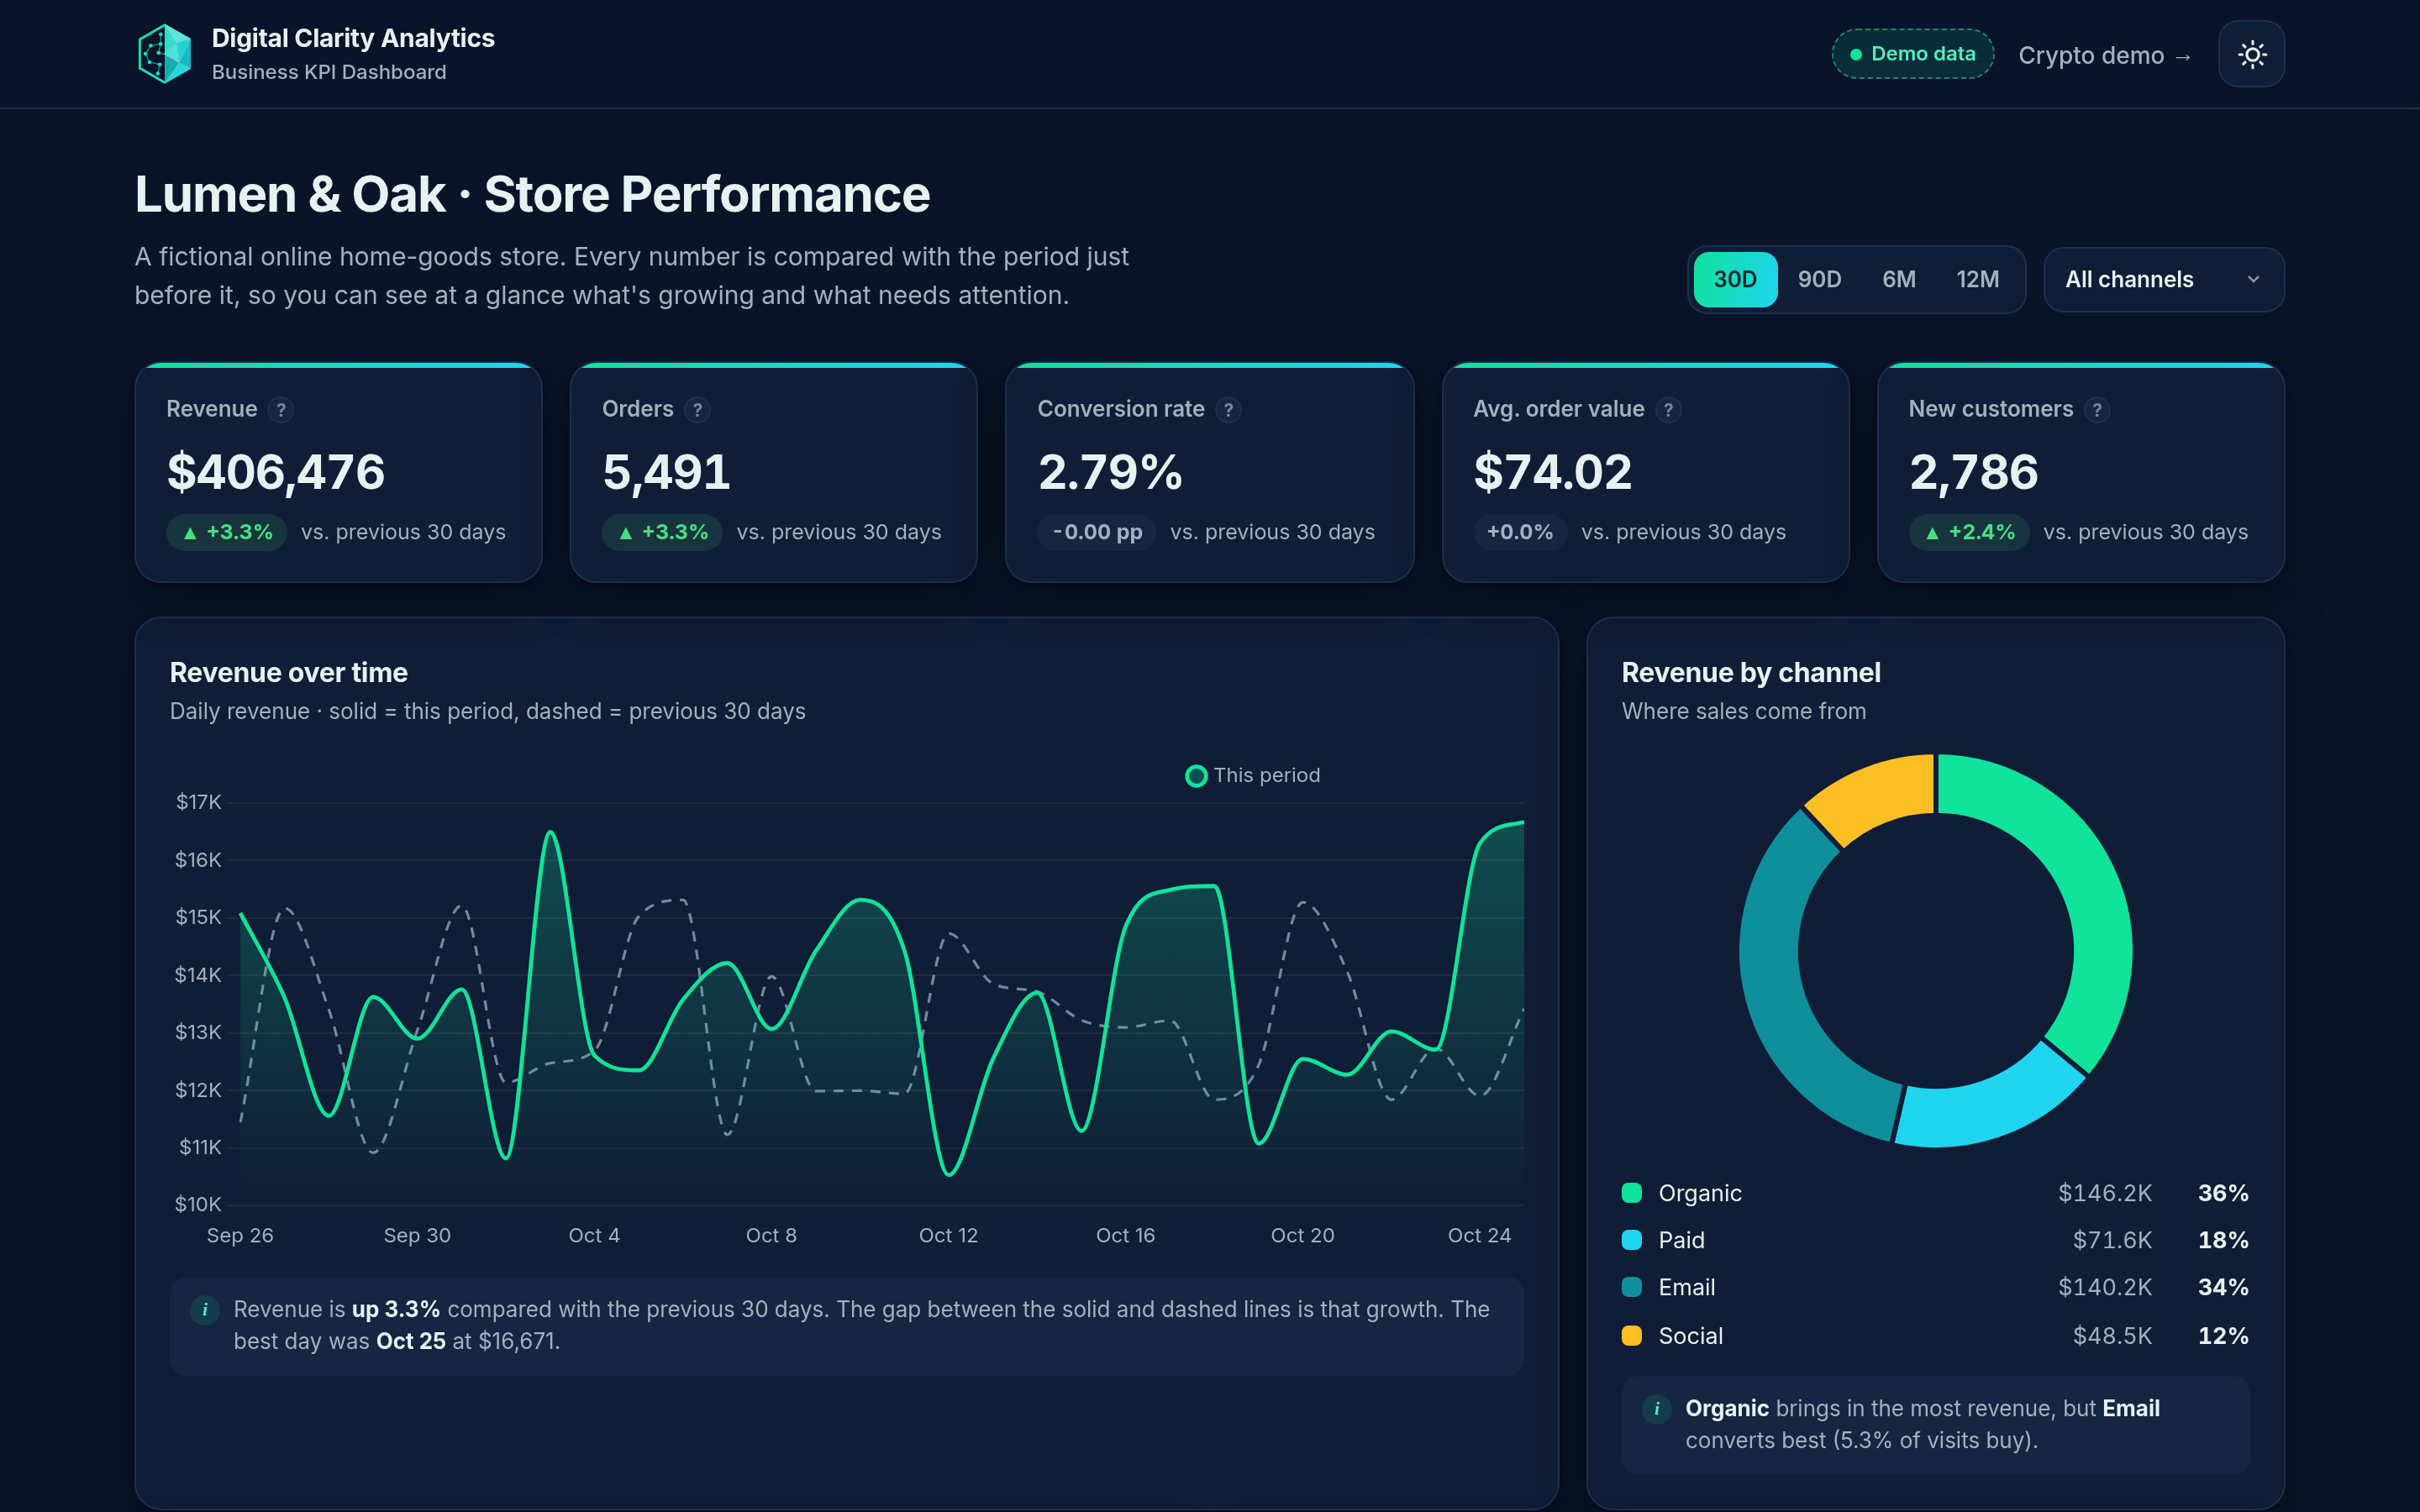
E-commerce KPI Dashboard
Revenue, orders, conversion funnel, top products, regions and cohort retention for a fictional online store.
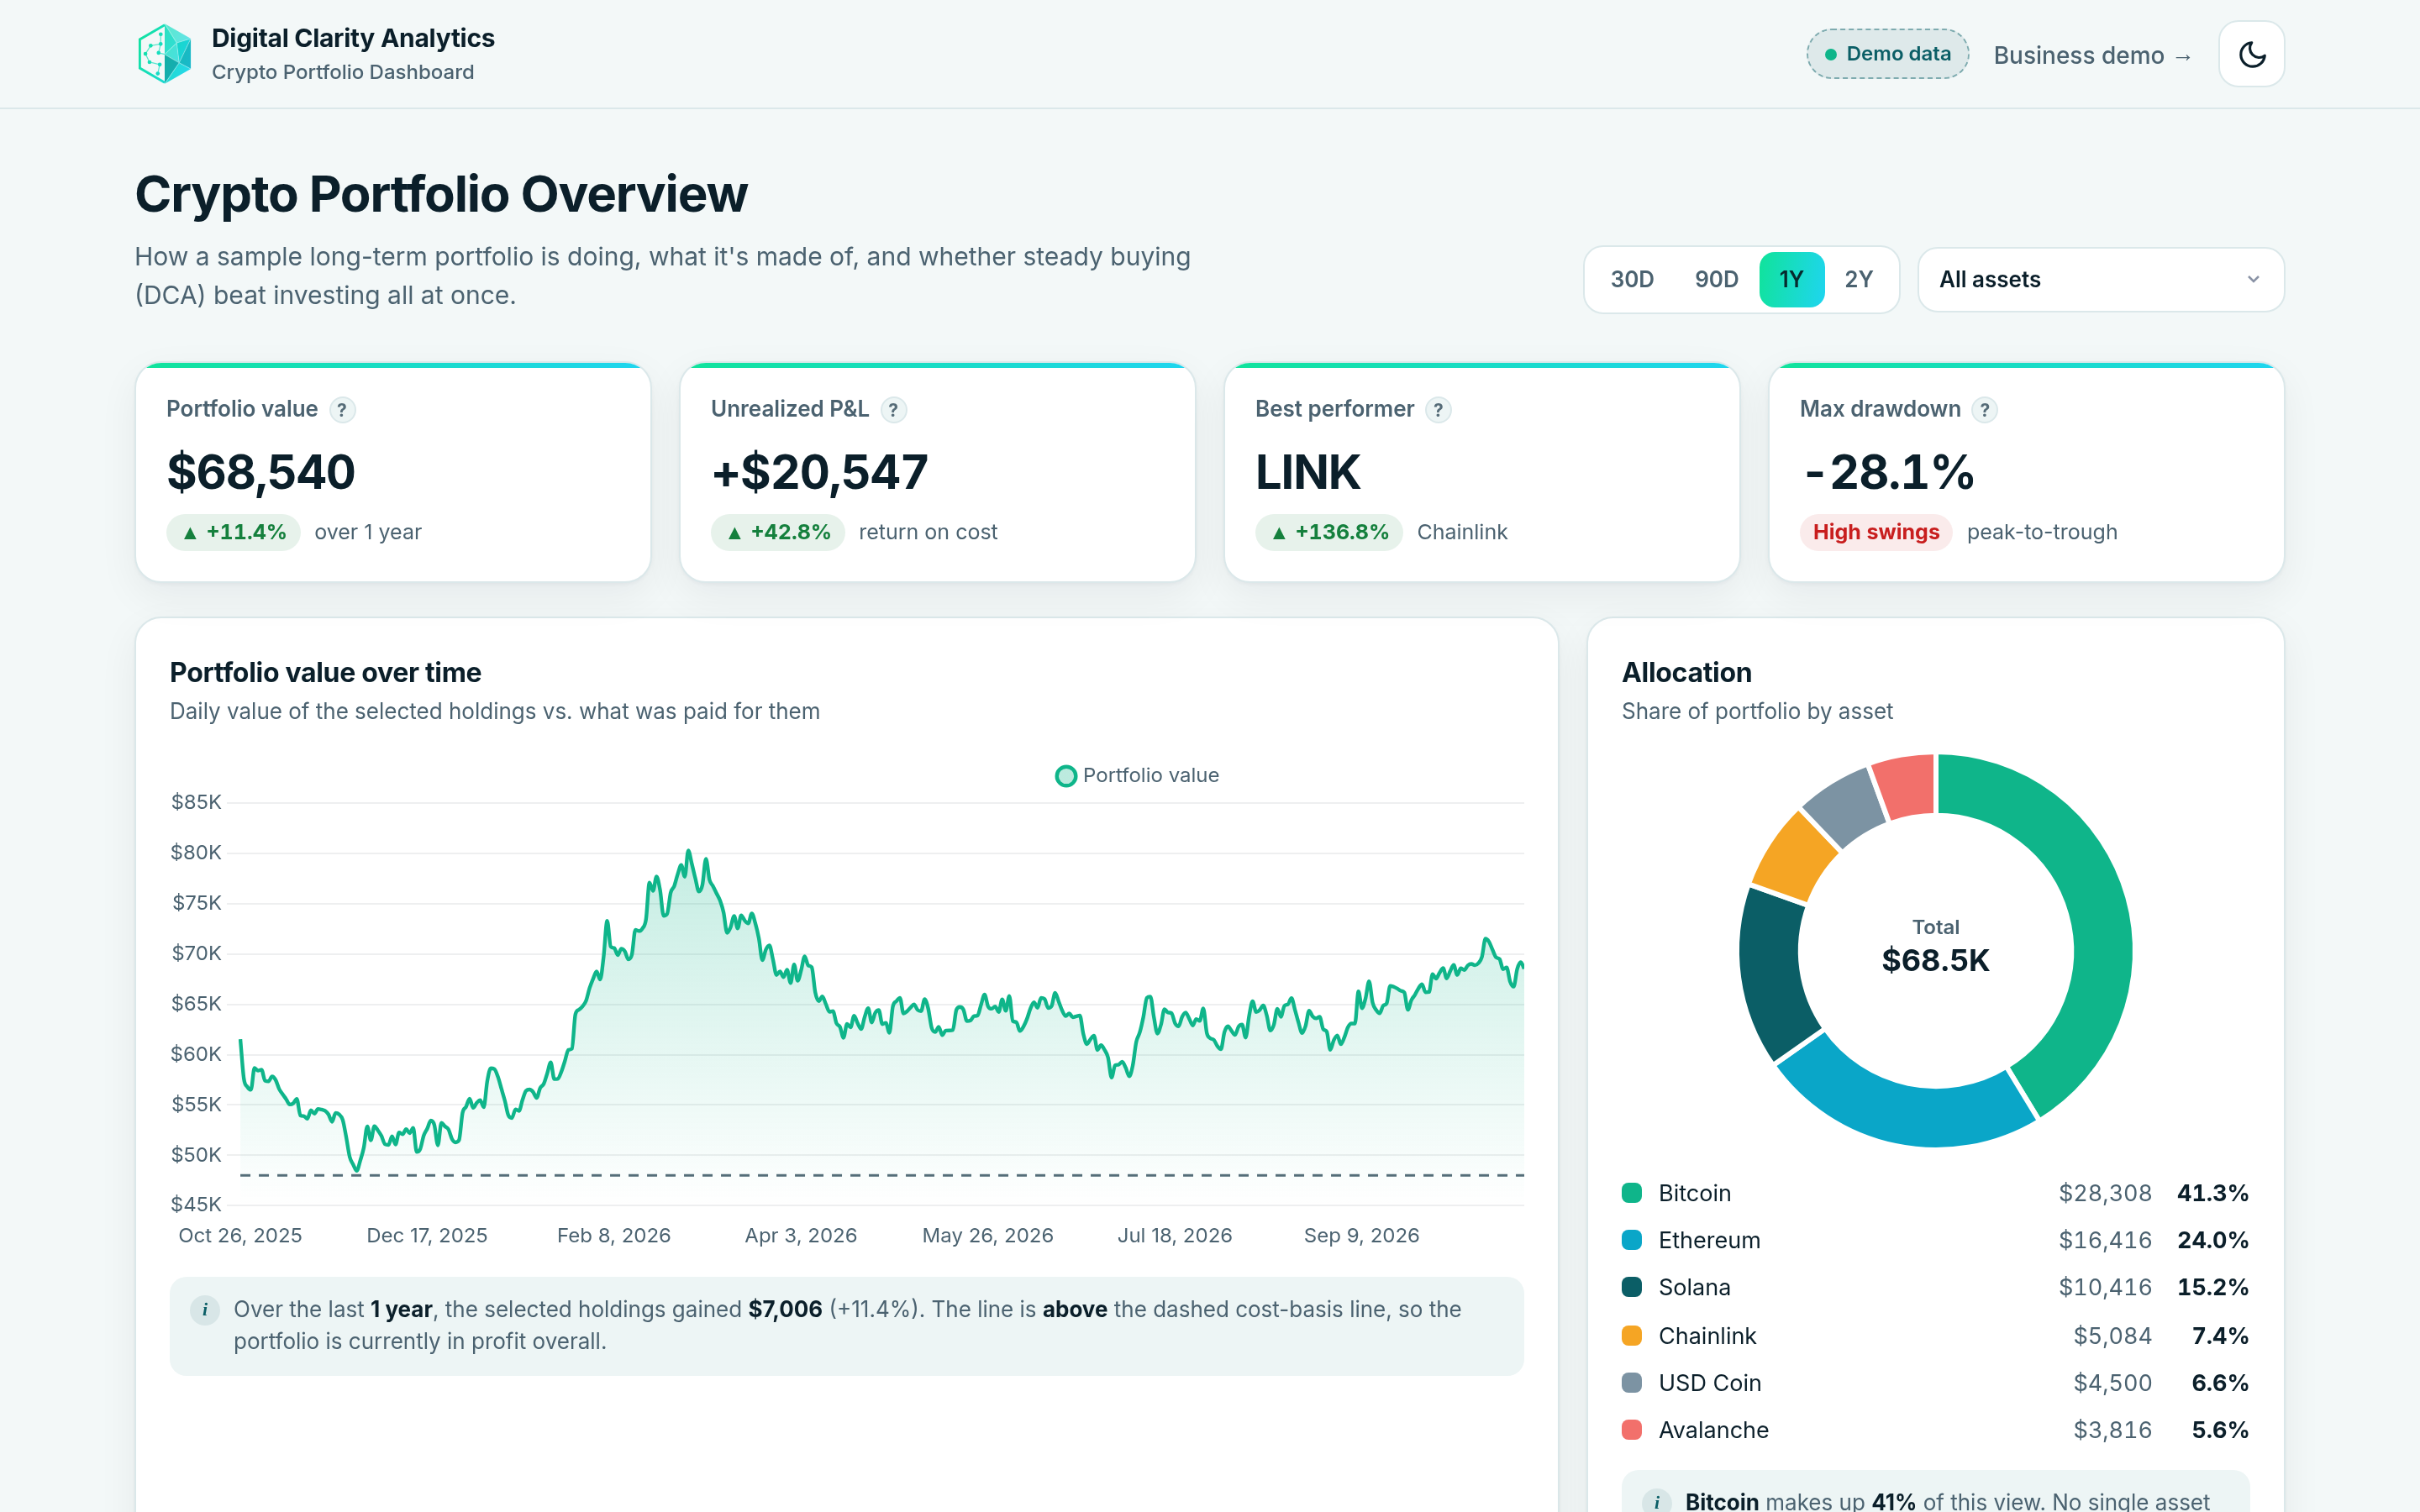
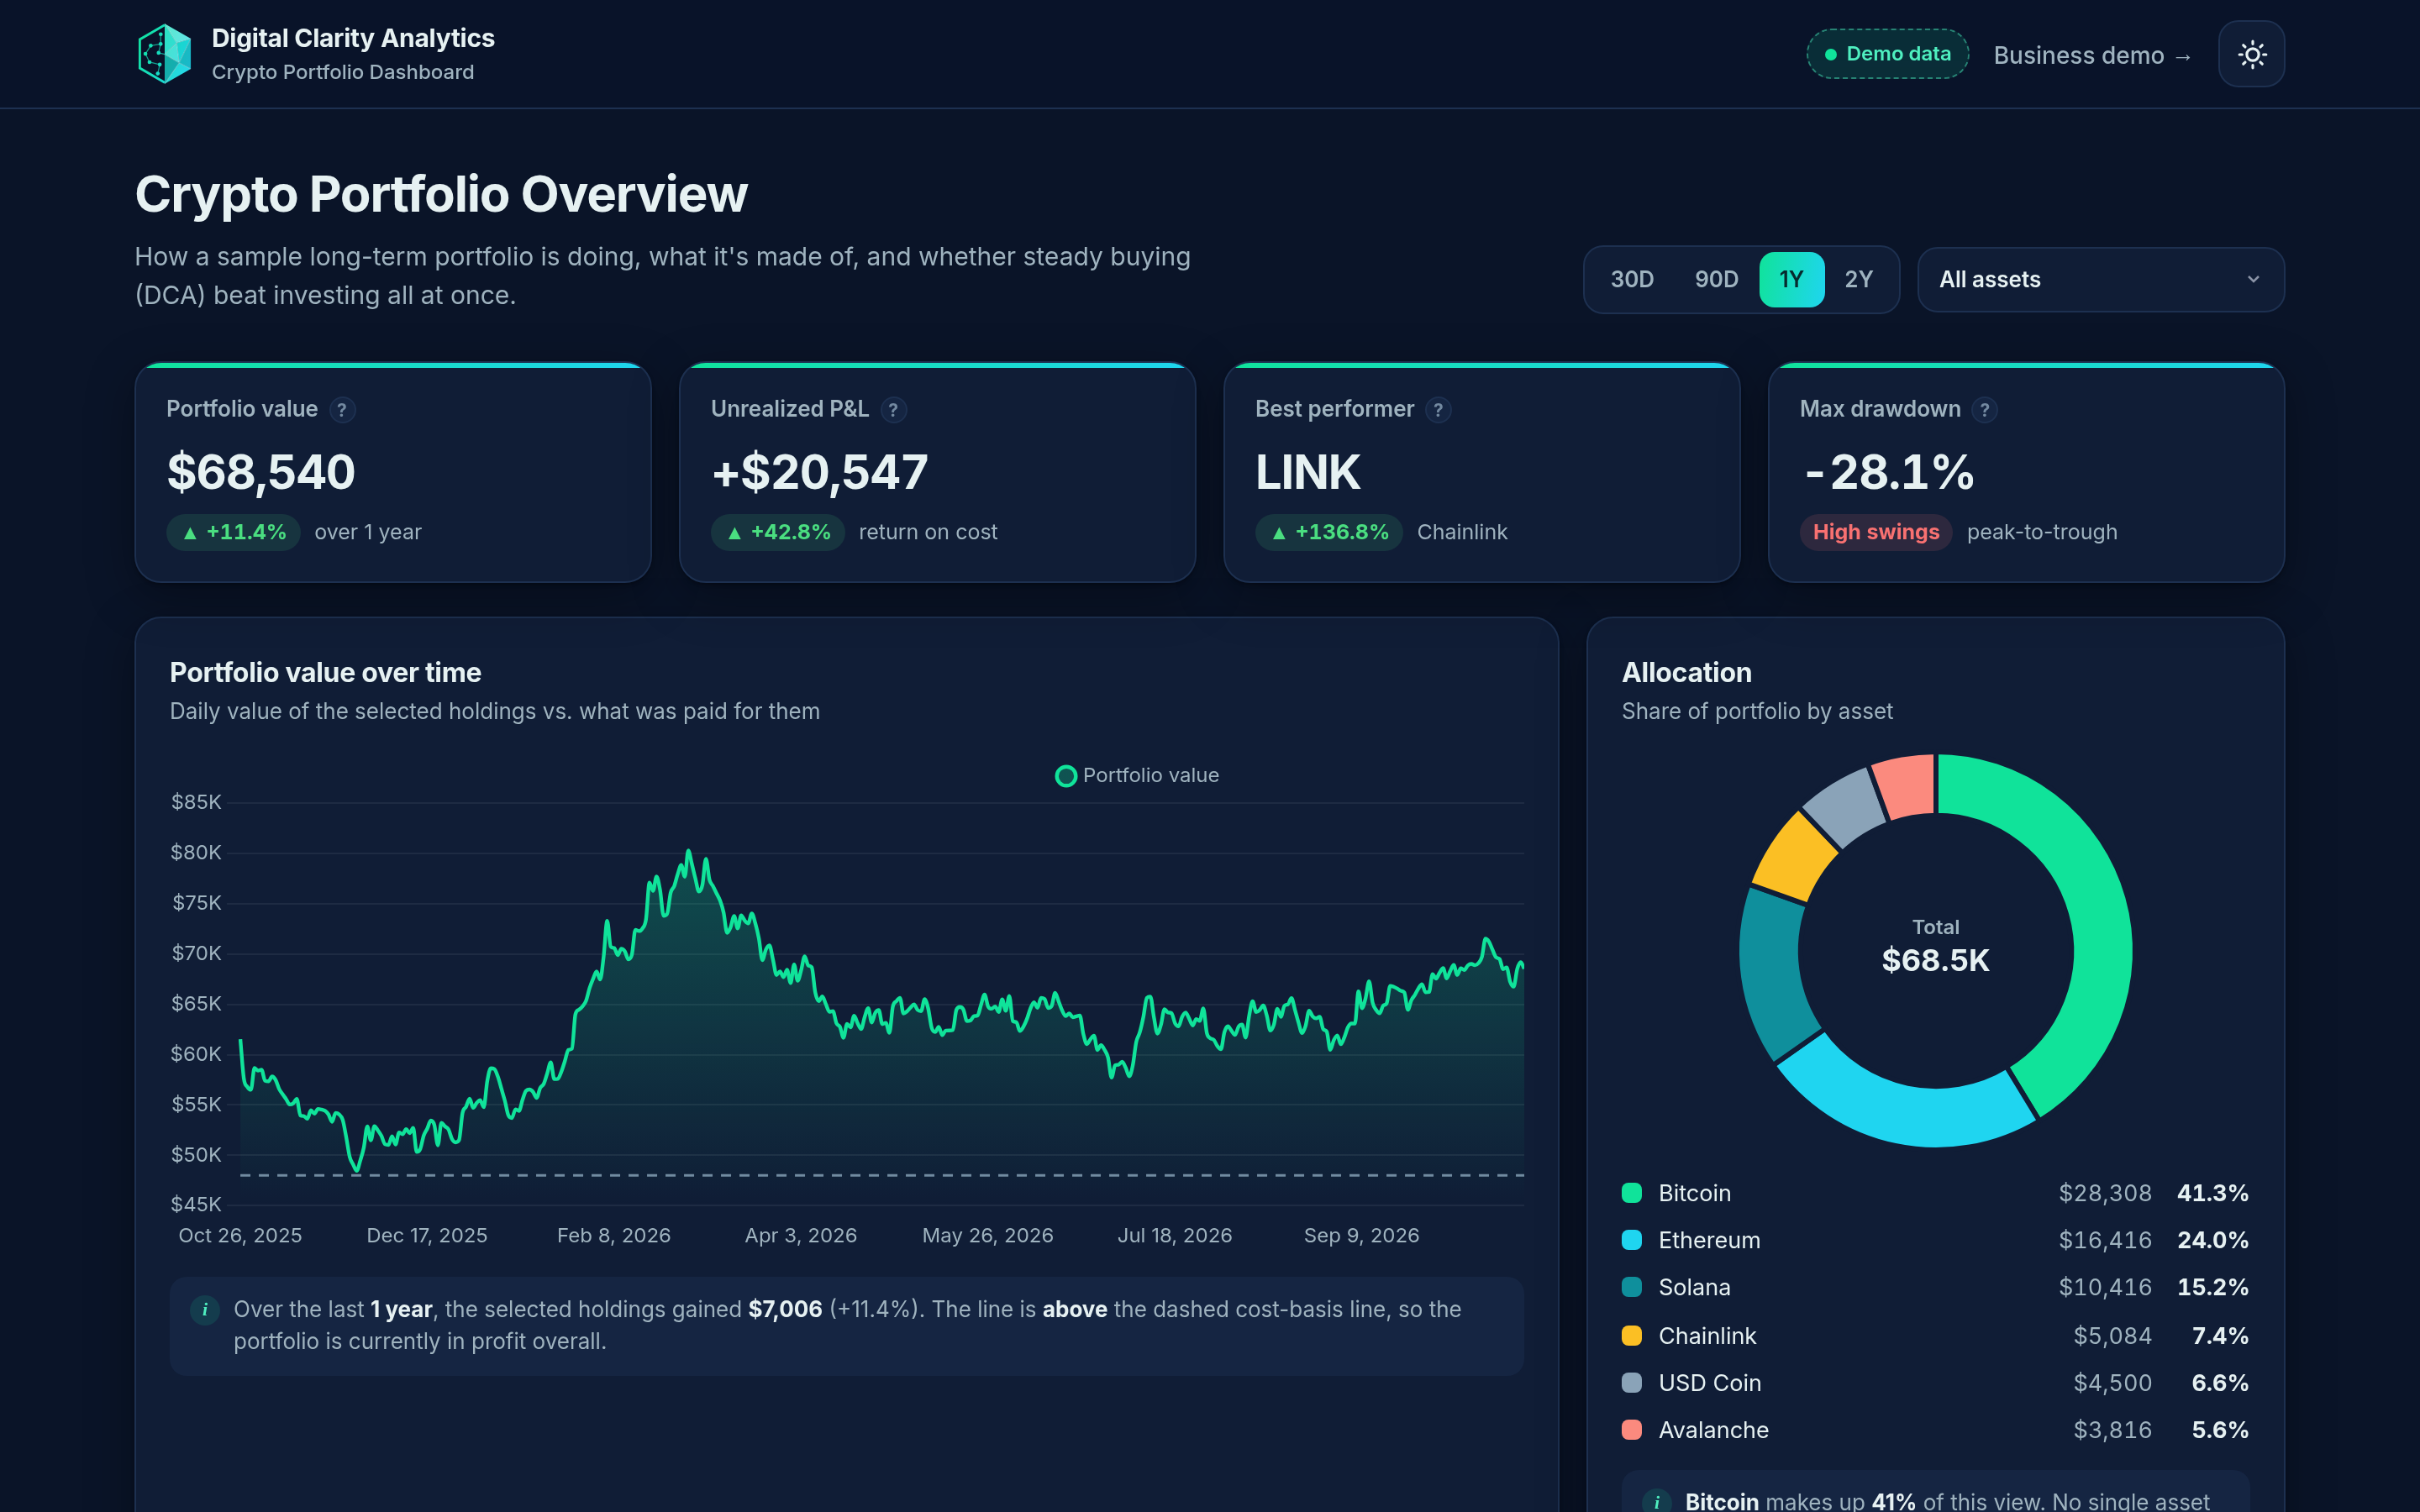
Crypto Portfolio & Market Dashboard
Holdings allocation, P&L over time, a DCA vs. lump-sum simulator, market overview and a sortable watchlist.
What you get
Dashboards built for the people who actually read them, not just analysts.
KPIs that explain themselves
Headline numbers with change vs. last period, tooltips on every metric, and one-line "what this means" notes.
Works everywhere
Responsive on phone, tablet and desktop, with light and dark mode. Fast, static, and cheap to host.
Your data, your tools
CSV, Google Sheets, Excel, Shopify, Stripe or exchange exports. Built with standard web tech, Looker Studio or Power BI.
How it works
Small, fixed-price projects with clear milestones.
Discovery call
We agree on the 5–10 numbers that matter and who will use the dashboard.
Mock-up
You see a clickable draft with your real data within a few days.
Build & refine
Two rounds of revisions, then filters, tooltips and mobile polish.
Launch
Hosted link or files delivered, plus a short walkthrough video.
Projects from $250
Three fixed-price packages. You see the scope and the price before any work starts.
Business
KPI dashboard
Your sales, orders and customer numbers from CSV, Excel, Google Sheets or similar exports, in one clear dashboard.
- Starter $250
- Standard $600
- Advanced $1,200
On-chain research
Wallet & token investigation
Where a wallet's or token's money came from and where it went, traced from public blockchain records, with a plain-English report.
- Starter $300
- Standard $750
- Advanced $1,500
Crypto
Portfolio & trading dashboard
Holdings, profit and loss, and fees from your exchange exports or wallets, in one readable view. Analytics only, not investment advice.
- Starter $275
- Standard $700
- Advanced $1,400
Every project includes two rounds of revisions. Higher tiers add more data sources, pages and depth. Changes after launch are $55/hr, or covered by a monthly plan below.
After launch
A dashboard is only useful if the data stays fresh. Pick the level of support you need, or take full ownership.
Hosting & Care
- Hosting and uptime checks
- Scheduled data refresh
- Bug fixes
- Small tweaks (labels, colors, a filter)
Growth
- Everything in Care
- Set monthly hours for new metrics, pages or reports
- Monthly check-in call
Ad hoc
- No commitment
- Pay only when you need a change
- Quoted up front
Full handoff
- All source files
- Setup and data-refresh docs
- Recorded walkthrough so your team can run it
Complex data? Let’s make it clear.
Tell me what you track today and what decisions you want to make faster. I'll reply with a quick plan and a fixed quote.
Or email [email protected]